Raspberry Pi Magnetometer
Real-time observations from Louisville, CO
Live Data
I monitor Earth's magnetic field from my backyard in Louisville, Colorado using an RM3100 magnetometer on a Raspberry Pi. Data from the USGS Boulder Observatory (~10 miles north) is plotted alongside for comparison.
Three dashboards are available: absolute magnetic coordinates (H, E, Z, F), absolute geographic coordinates (X, Y, Z, F), and calibrated daily vector variations with Louisville overlaid on Boulder.
About This Station
The station measures four components of the geomagnetic field in the HEZ coordinate system: horizontal intensity (H) pointing toward magnetic north, magnetic east (E), vertical intensity (Z) pointing downward, and total field (F). Variations in these measurements indicate geomagnetic storms and substorms caused by solar activity.
Installation
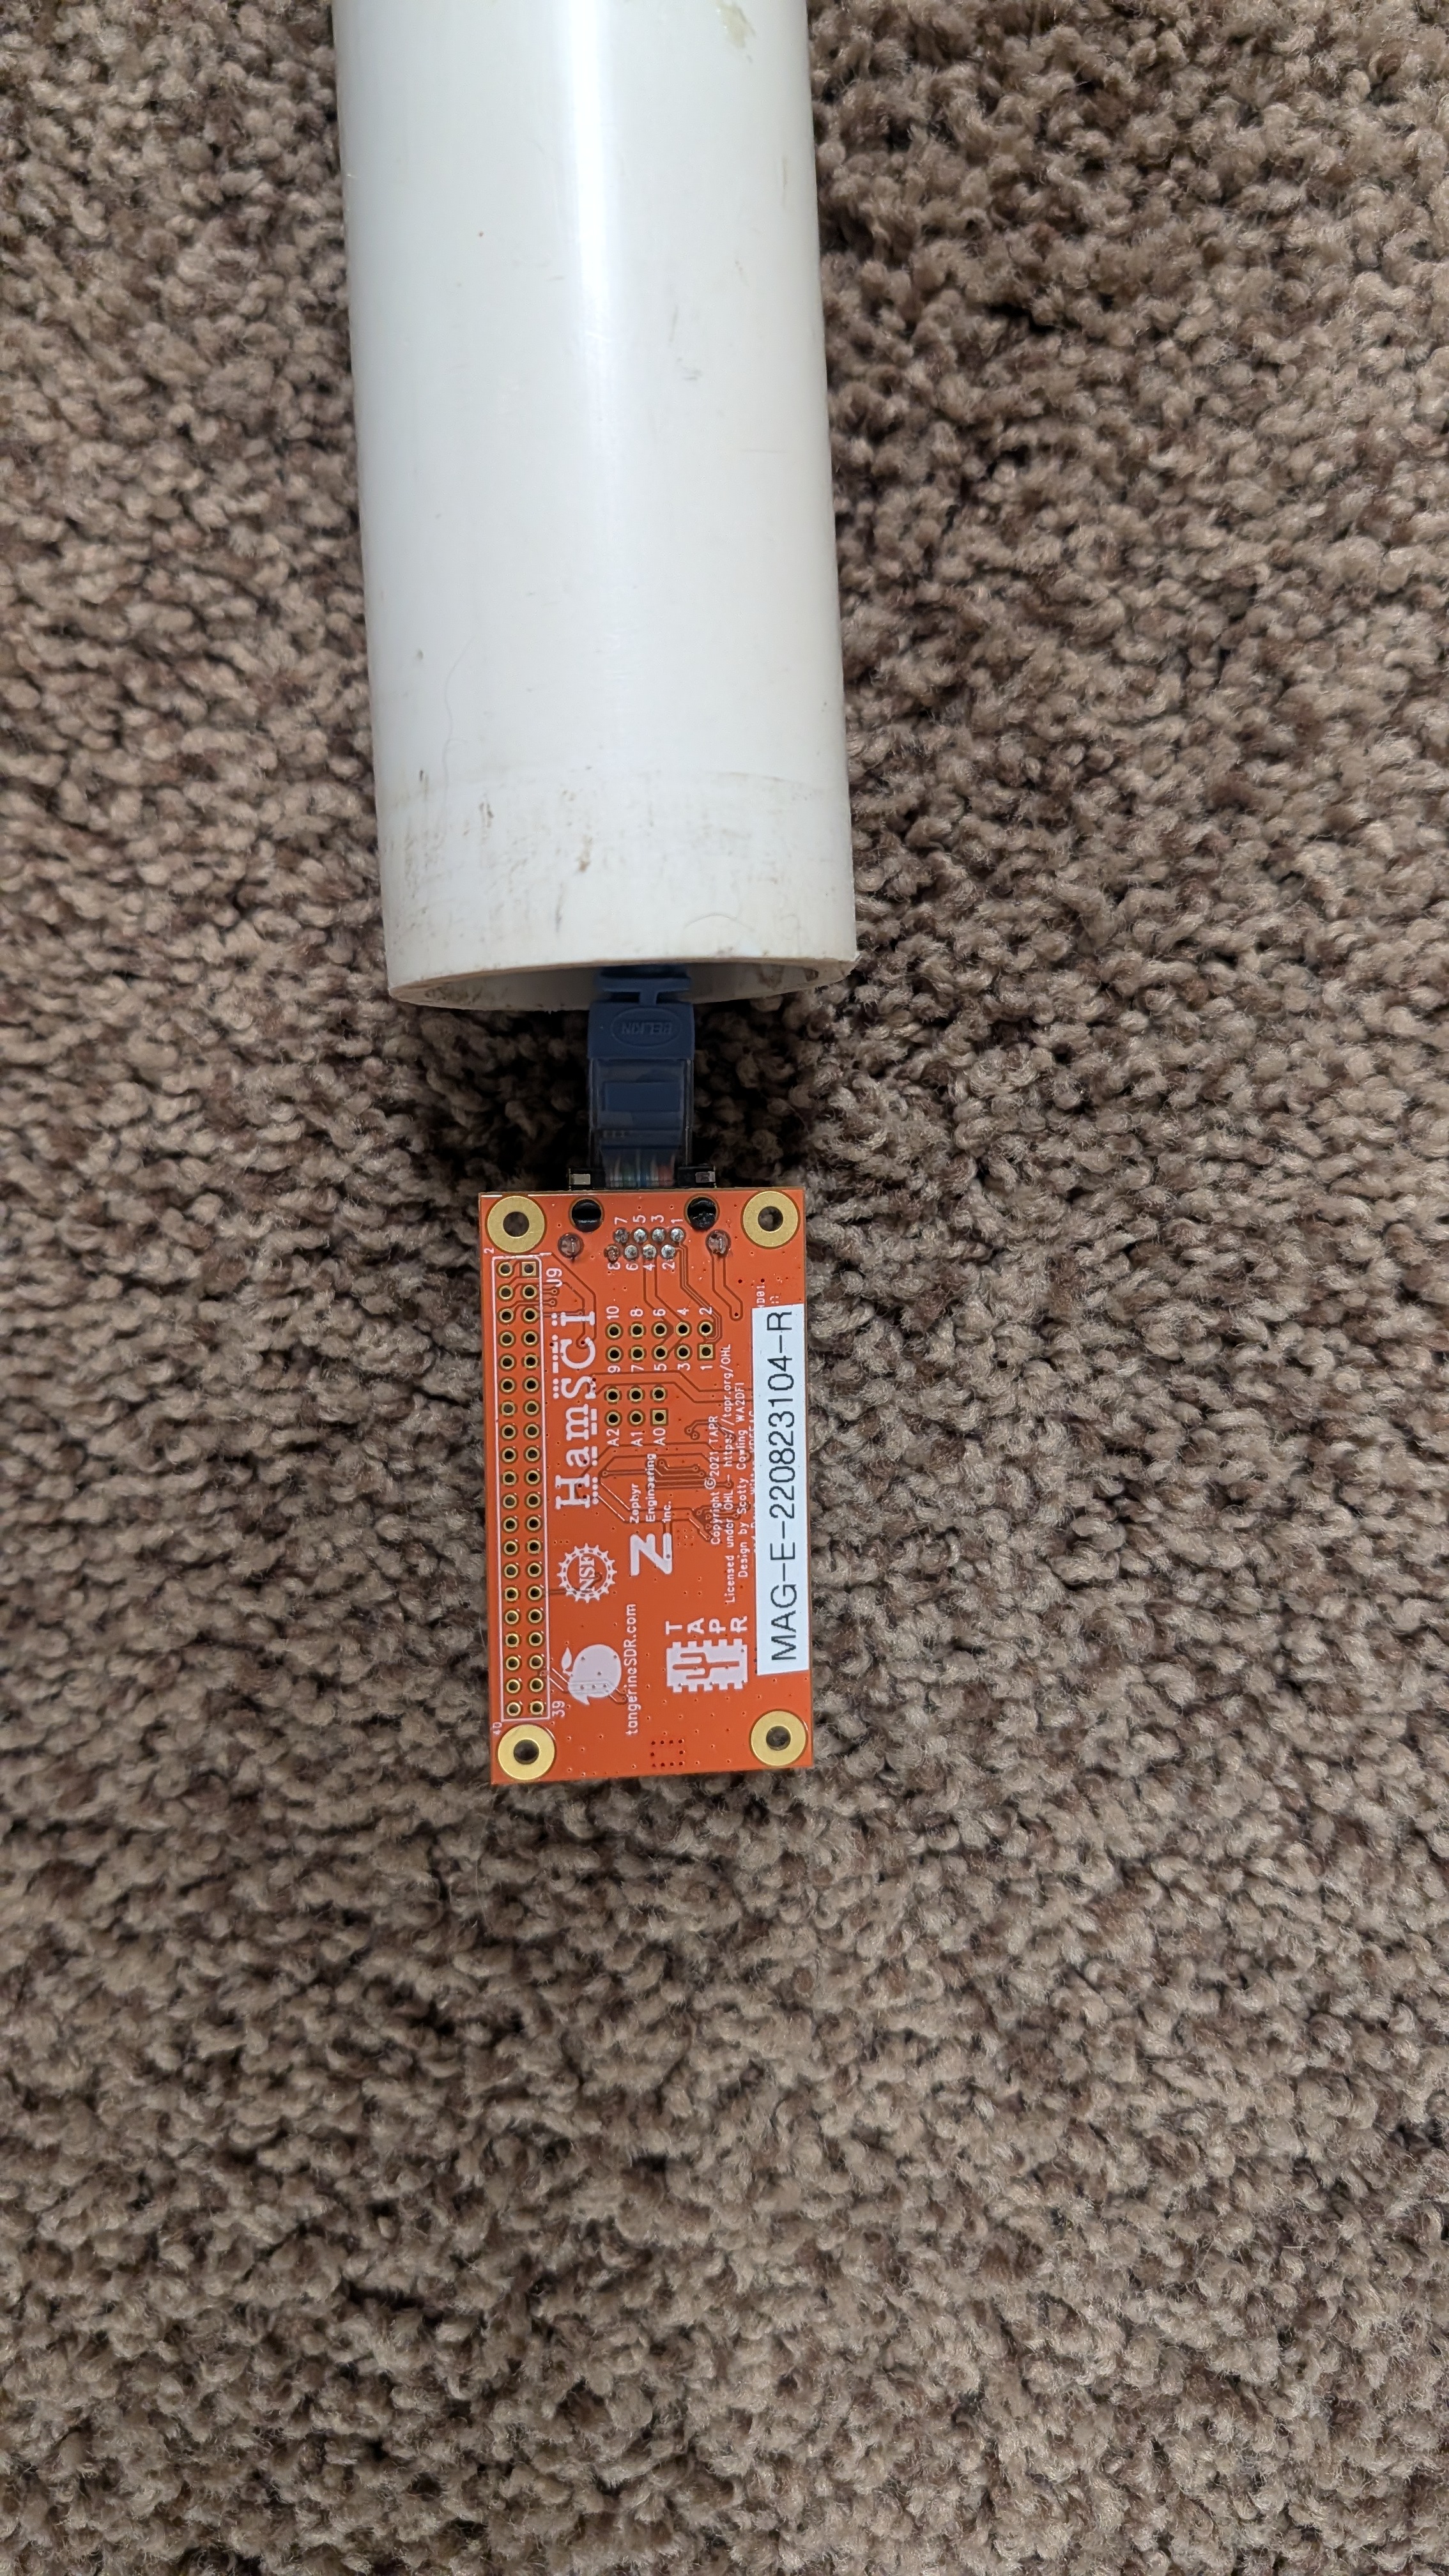
The magnetometer uses a PNI RM3100 magneto-inductive sensor with a noise floor of ~4 pT/√Hz at 1 Hz. I ordered the kit from HamSCI and followed their PSWS Ground Magnetometer installation guide.
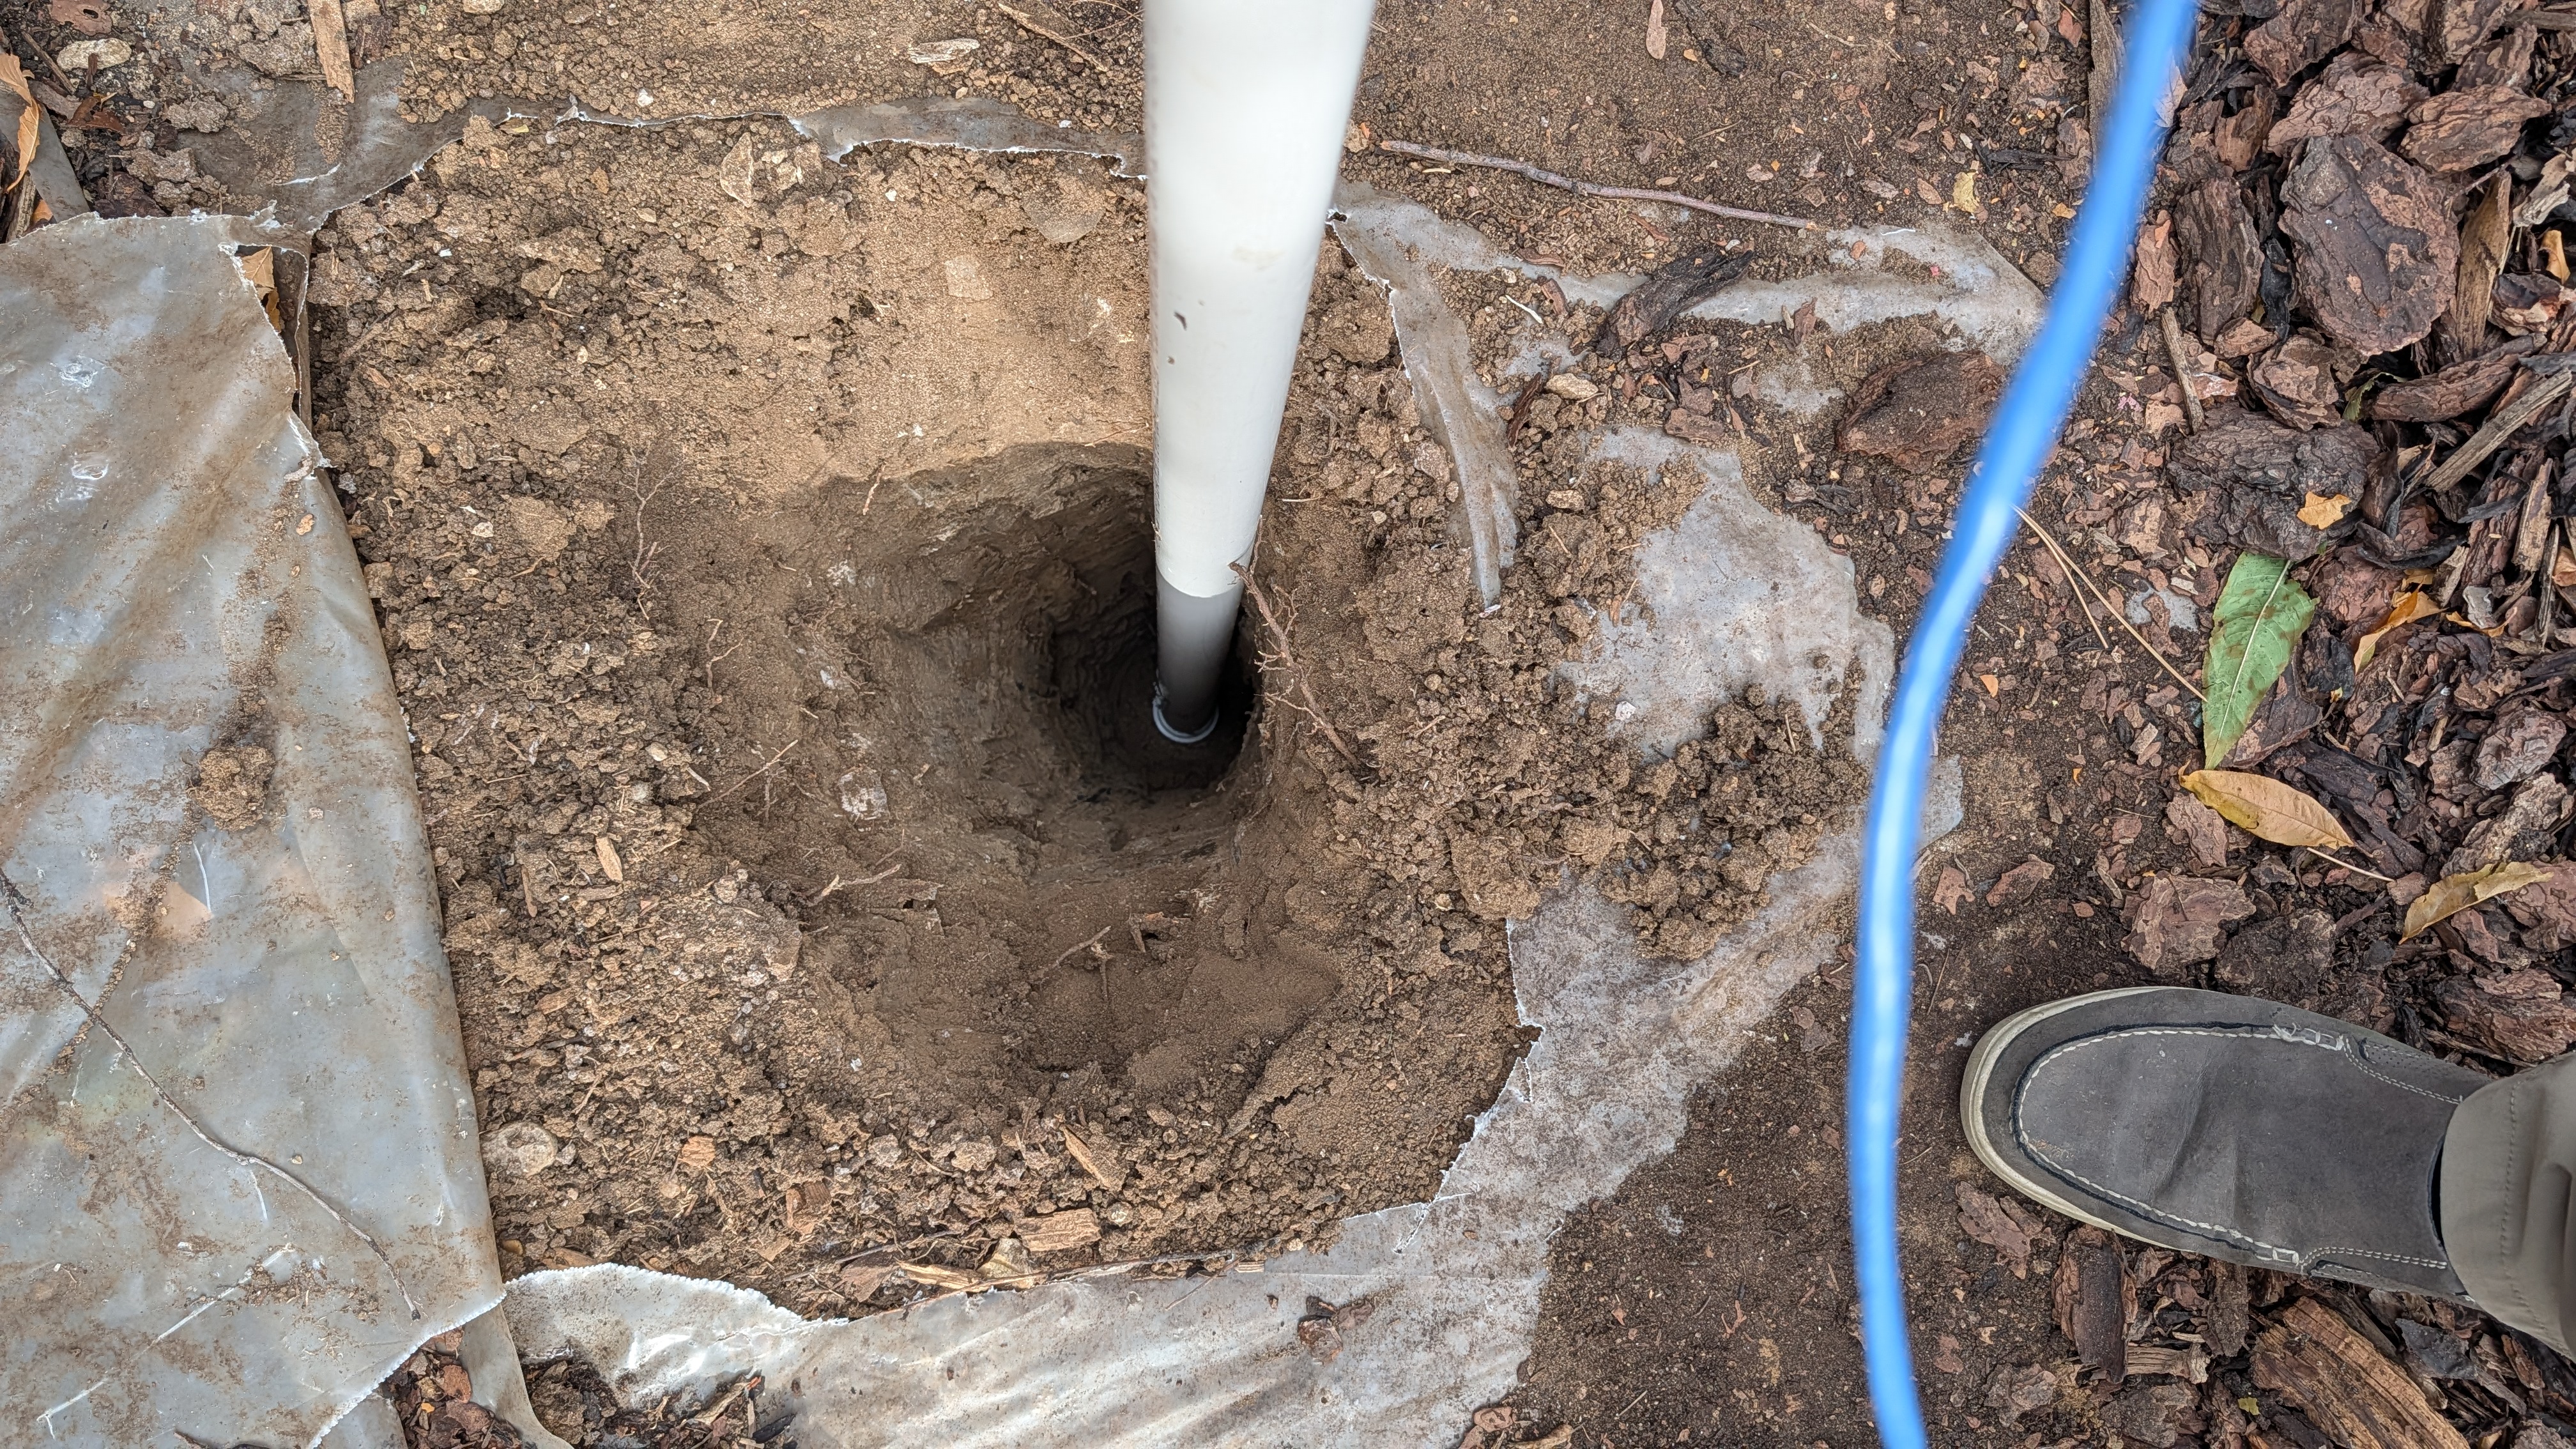
The sensor is housed in a PVC pipe and buried vertically approximately 3 feet underground for temperature stability and electromagnetic isolation. It is oriented so the H-axis points toward magnetic north, determined by rotating the assembly until the E component reads near-zero. A shielded CAT6 Ethernet cable runs underground to my shed, where the Raspberry Pi handles data acquisition and transmission to a cloud database.
Since the sensor is in a residential backyard exposed to various sources of magnetic noise, I expect a resolution of 10–20 nT. The raw 1-second data exhibits a periodic fluctuation with a period of ~10–11 seconds and amplitude of approximately 10 nT, which is not removed before averaging to 1-minute data.
Calibration and Limits
The database keeps the sensor measurements unchanged. Corrections are applied only when the data are displayed.
I aligned the sensor approximately during installation. The record shows an abrupt change on 22 February 2026, probably from a small shift in the buried assembly. The field-level HEZF and XYZF dashboards therefore use separate component corrections before and after that event.
The Daily Variations dashboard uses a fixed three-axis rotation and gain matrix estimated from historical comparisons with Boulder after the February event. On held-out data, it reduced the vector difference from about 20 nT to 12 nT. Louisville and Boulder are processed separately, so the Louisville trace does not require Boulder data in real time.
This is not an absolute observatory calibration. The sites are about 10 miles apart, and the backyard sensor is affected by local magnetic noise. Slow seasonal drift in Z and F can reach about 150 nT, so the field-level dashboards are less reliable than the short-term variations.
The variation dashboard currently removes a separate median from each UTC day, which can produce a small step at 00:00 UTC. I am recording sensor temperature and testing a quiet-night baseline method, but neither correction has been deployed.
Installation Photos